AAAI Conference on Artificial Intelligence (AAAI 2023)
Authors
Georg Kohl, Technical University of Munich
Li-Wei Chen, Technical University of Munich
Nils Thuerey, Technical University of Munich
Abstract
Simulations that produce three-dimensional data are ubiquitous in science, ranging from fluid flows to plasma physics. We propose a similarity model based on entropy, which allows for the creation of physically meaningful ground truth distances for the similarity assessment of scalar and vectorial data, produced from transport and motion-based simulations. Utilizing two data acquisition methods derived from this model, we create collections of fields from numerical PDE solvers and existing simulation data repositories, and highlight the importance of an appropriate data distribution for an effective training process. Furthermore, a multiscale CNN architecture that computes a volumetric similarity metric (VolSiM) is proposed. To the best of our knowledge this is the first learning method inherently designed to address the challenges arising for the similarity assessment of high-dimensional simulation data. Additionally, the tradeoff between a large batch size and an accurate correlation computation for correlation-based loss functions is investigated, and the metric’s invariance with respect to rotation and scale operations is analyzed. Finally, the robustness and generalization of VolSiM is evaluated on a large range of test data, as well as a particularly challenging turbulence case study, that is close to potential real-world applications.
Keywords
metric learning, CNNs, PDEs, numerical simulation, perceptual evaluation, physics simulation
Links![]() Preprint
Preprint![]() PDF
PDF![]() Source Code
Source Code![]() Data Download
Data Download![]() DOI
DOI
Motivation
Assessing the similarity of data from numerical simulations is a fundamental problem across disciplines. The main challenge is to capture the similarity of larger structures or patterns (e.g. a vortex in a turbulence simulation), compared to the element-wise operations performed by traditional metrics like the L² distance. We examined this problem in the context of our CNN-based metric LSiM for scalar 2D simulation data. In this follow-up work, we target the substantially more complex domain of vectorial 3D data, while also improving the underlying methodology of the CNN and the training process.
Data and Training
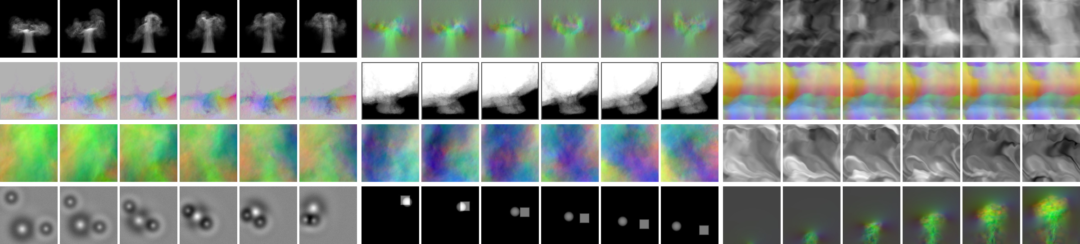
The main data acquisition techniques remain similar to LSiM, as we 1) create data by incrementally altering one initial condition of a reference simulation, or 2) collect data from repositories by creating data pairs via spatio-temporal changes. For the former method, we utilize simulations of an advection-diffusion model, Burger’s equation, and the full Navier-Stokes equations via FLIP liquids and smoke plumes. The latter method is ideal for repositories as the ScalarFlow data set, that features velocity reconstructions of captured smoke plumes, and direct numerical simulations from the Johns Hopkins Turbulence Database (JHTDB). In contrast to LSiM, ground truth distances for the training are determined via a proposed entropy-based similarity model. It takes the linearly increasing distances implicitly provided by the data acquisition, and transforms them through a logarithmic, monotonic, non-linear function based on pre-computed coefficients. To train the metric, a pair of simulation fields are processed by a Siamese feature extractor network with shared weights (see sections Architecture / Data Generation and Training for LSiM) and the resulting feature difference is compared to the ground truth distance.
Architecture
To extract features from the inputs, we propose the multiscale CNN shown in Fig. 1. It processes the data on different scales, while also allowing interactions between different scales through resolution connections. The resulting network is more stable to input transformations such as rotations and scaling compared to simpler CNN architectures.
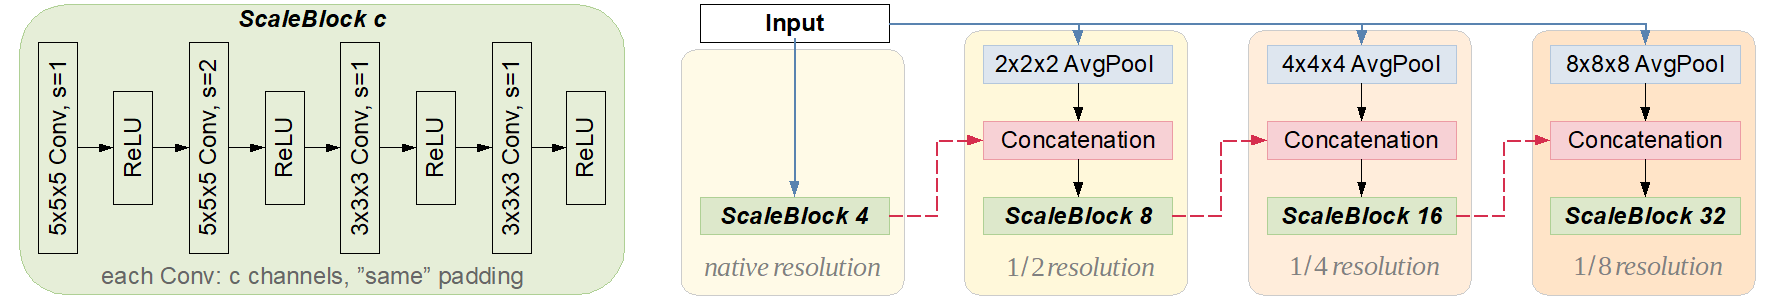 Fig. 1: Standard Conv+ReLU blocks (left) are interwoven with input and resolution connections (blue dotted and red dashed) to form the combined network architecture (right). The output of each scale block is concatenated with the downsampled input for lower scales, leading to features that are spread across multiple resolutions for a stable metric computation.
Evaluation
To compare the accuracy of VolSiM against other metrics, we use correlation values between ground truth and predicted distances as a performance measure. They describe how well the relationship between two sets of distance measurements can be modelled with a linear or monotonic function, where a higher correlation value indicates that a metric better reconstructs the ground truth. On our combined test data VolSiM achieves a correlation of 0.85, while the commonly used L² metric only results in 0.70 and a sliced application of LSiM reaches 0.81.
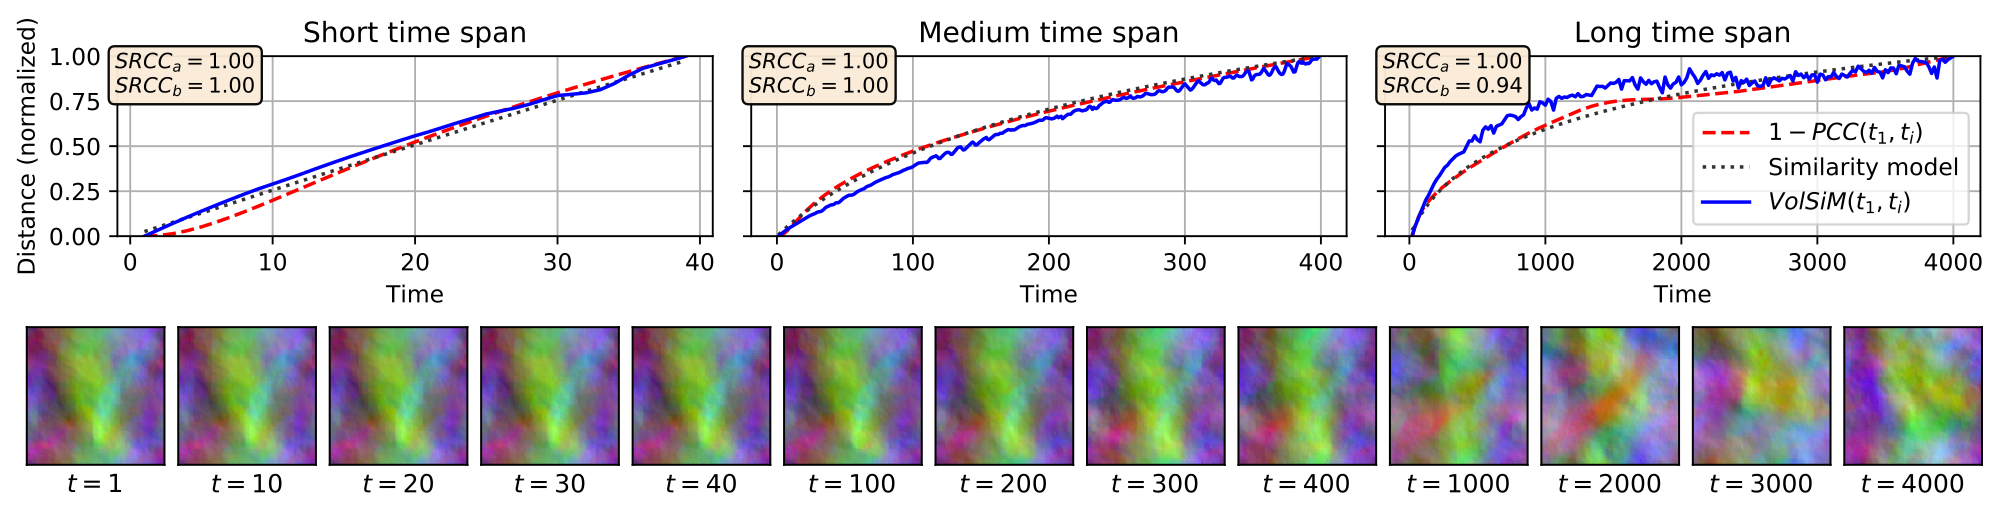 Fig. 2: Top: Analysis of forced isotropic turbulence across three time spans. The high correlation values indicate strong agreement between Pearson’s distance and the similarity model (SRCCᵃ), and between the similarity model and VolSiM (SRCCᵇ). Bottom: Examples from the overall isotropic turbulence sequence, visualized via color-coded velocity channels.
To further study the generalization of VolSiM on an example close to real-world applications, we performed a case study on forced isotropic turbulence, shown in Fig. 2. Displayed are the distances between the first time step t₁ and each following time step tᵢ for VolSiM and Pearson’s distance 1-PCC(t₁, tᵢ), as well the proposed similarity model. The distance trajectories are then compared with Spearman’s correlation coefficient SRCC. The resulting values indicate that the similarity model is a good match for Pearson’s distance, which is similar to two-point correlations commonly employed in turbulence research (SRCCᵃ). Furthermore, VolSiM reconstructs the distances from the similarity model quite accurately (SRCCᵇ).