International Conference on Machine Learning (ICML 2020)
Authors
Georg Kohl, Technical University of Munich
Kiwon Um, Technical University of Munich
Nils Thuerey, Technical University of Munich
Abstract
We propose a neural network-based approach that computes a stable and generalizing metric (LSiM) to compare data from a variety of numerical simulation sources. We focus on scalar time-dependent 2D data that commonly arises from motion and transport-based partial differential equations (PDEs). Our method employs a Siamese network architecture that is motivated by the mathematical properties of a metric. We leverage a controllable data generation setup with PDE solvers to create increasingly different outputs from a reference simulation in a controlled environment. A central component of our learned metric is a specialized loss function that introduces knowledge about the correlation between single data samples into the training process. To demonstrate that the proposed approach outperforms existing metrics for vector spaces and other learned, image-based metrics, we evaluate the different methods on a large range of test data. Additionally, we analyze generalization benefits of an adjustable training data difficulty and demonstrate the robustness of LSiM via an evaluation on three real-world data sets.
Keywords
metric learning, CNNs, PDEs, numerical simulation, perceptual evaluation, physics simulation
Links![]() Preprint
Preprint![]() PDF
PDF![]() Source Code
Source Code![]() Data Download
Data Download![]() DOI
DOI
Motivation
Assessing similarity for complex data is a fundamental problem in all computational disciplines ranging from simulations of blood flow to aircraft design. Many practical problems rely on highly complex PDEs, where small perturbations in the input drastically alter the solutions. Regular vector space metrics like the L² distance are unreliable as they perform an element-wise comparison, and thus cannot compare contextual information or structures on different scales as shown in Fig. 1. Our approach employs convolutional neural networks (CNNs) as a method to extract and compare more meaningful features from a set of two simulation frames.
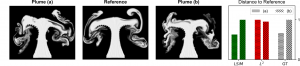 Fig. 1: Comparisons of two different smoke plumes to a reference with normalized distances for different metrics (smaller distances indicate higher similarity). Our method (LSiM, green) approximates the ground truth distances (GT, gray) well, while an L² metric (red) erroneously yields a reversed ordering.
Architecture
In Fig. 2 the general architecture of LSiM is displayed. The most important part is the Siamese base network with shared weights for both inputs, that consists of multiple convolution + ReLU layers for feature extraction. Next, the activations are normalized, compared in latent space and combined to a scalar distance value with simple or learned aggregation functions.
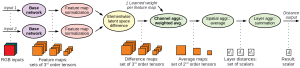 Fig. 2: Proposed distance computation with an exemplary base network that contains three layers with four feature maps each. Bold operations are learned and contain weights influenced by the training process.
Data Generation and Training
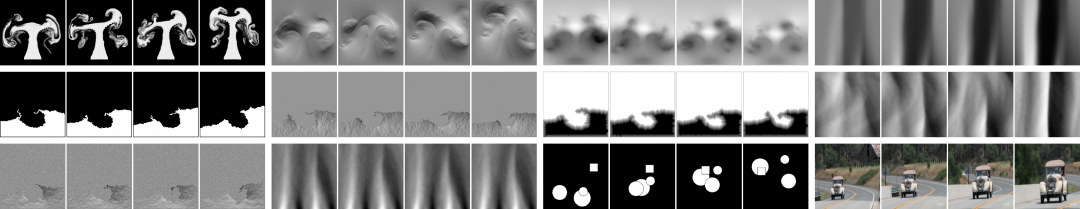
The data to train the metric originates from a large range of numerical simluations of PDEs, i.e., a pure advection-diffusion model, Burger’s equation which adds a viscosity term and the full Navier-Stokes equations with the mass conservation constraint (see top two rows in title figure). To create sequences with ground truth distances, one initial condition of a reference simulation is varied incrementally, e.g., the buoyancy force in a smoke simulation or the initial position of a fluid drop in a liquid simulation. The data to test the generalization of our metric is far outside the training data range. It features liquid and advection-diffusion data with a different setup and sequential frames of randomized moving shapes and captured videos (see bottom row in title figure).
Evaluation
To compare LSiM to other metrics, we used correlation between ground truth and predicted distances as a performance measure. Correlation describes how well the relationship between two sets of measurements can be modelled with a linear or monotonic function (depending on the used correlation variant). As a result, a higher correlation value on the test data indicates a metric that generalizes better. On the combined test data LSiM achieves the correlation 0.73, while the commonly used L² metric results in a value of 0.61 and structural similarity (SSIM) only reaches 0.53.
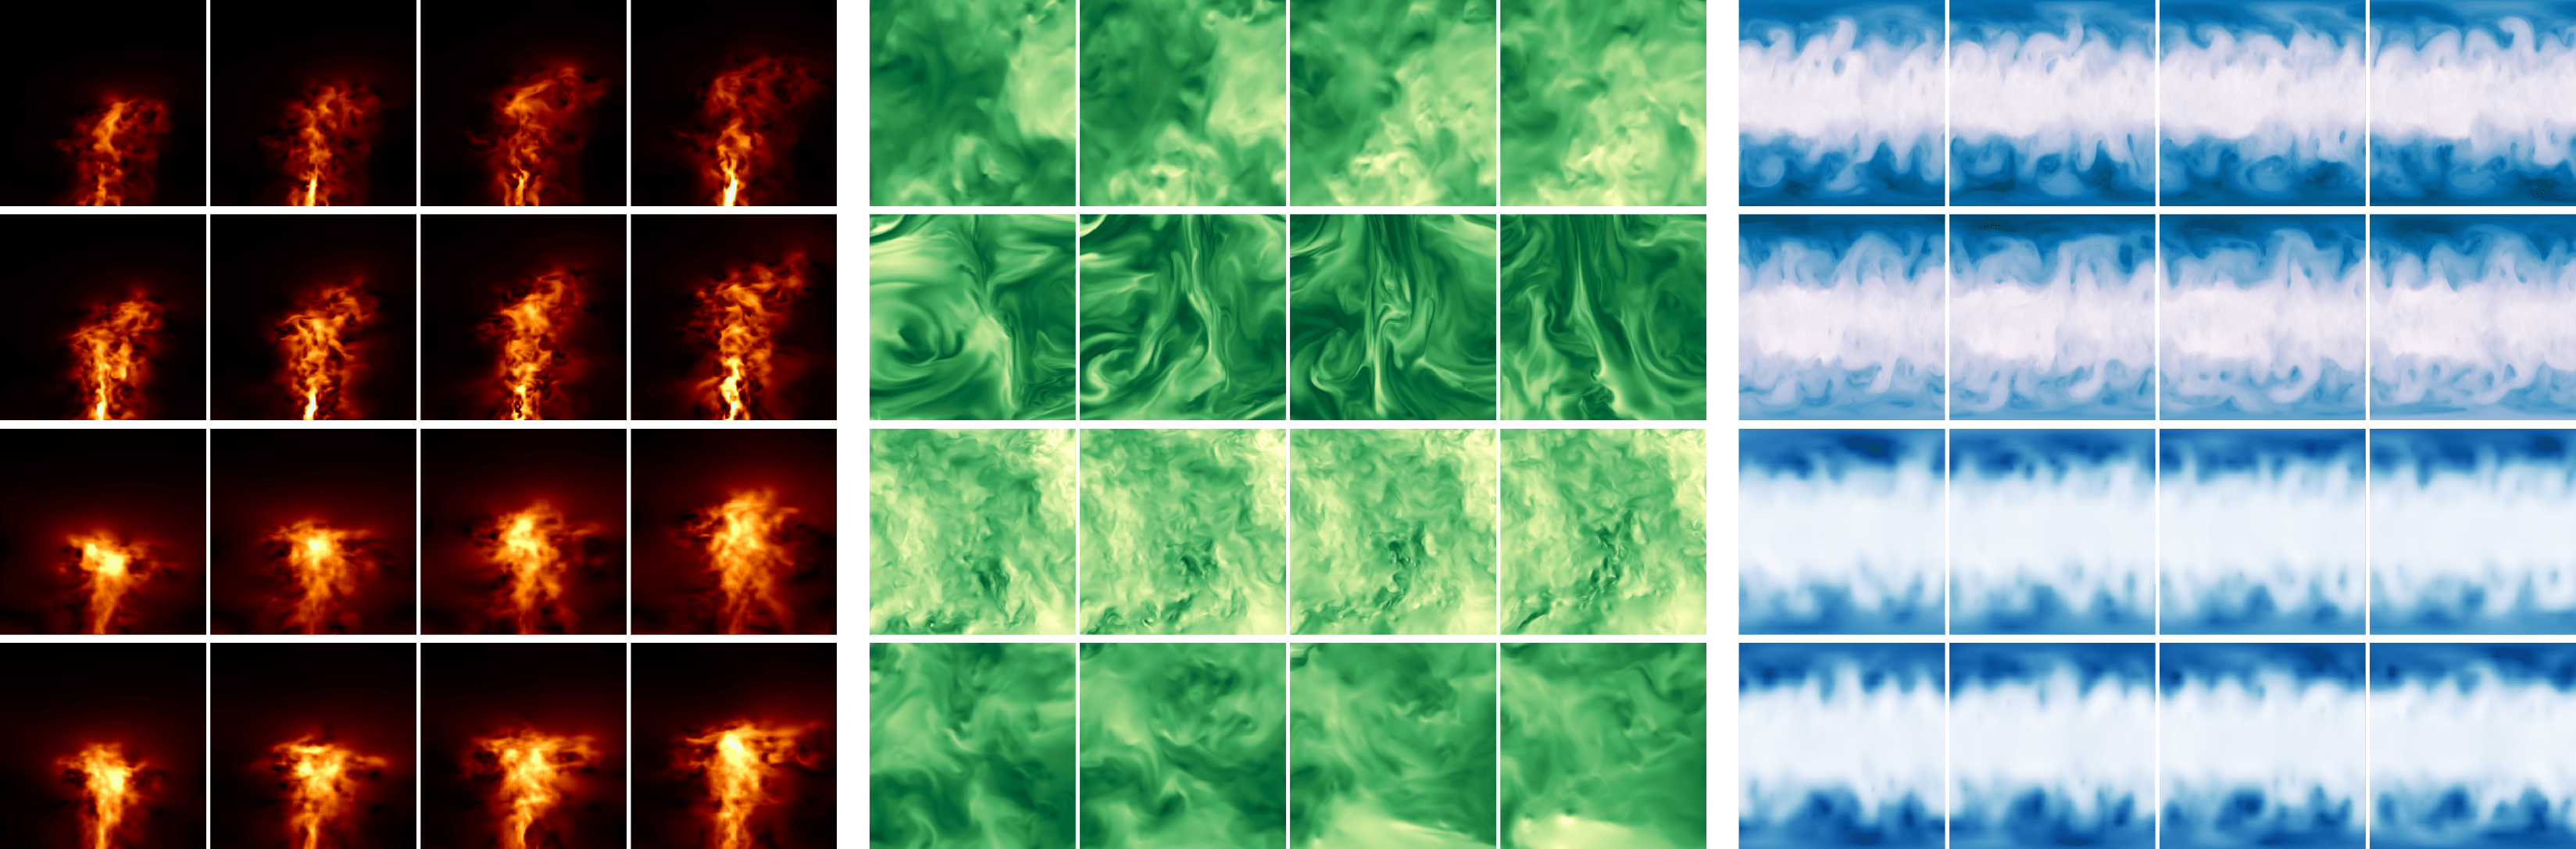 Fig. 3: Color-mapped example sequences from the real-world data repositories ScalarFlow (orange), JHTDB (reen), and WeatherBench (blue).
To further show the robustness of our metric, three real-world data repositories are evaluated (see Fig. 3). We employ the ScalarFlow data set, that features velocity reconstructions of captured smoke plumes. Furthermore, the Johns Hopkins Turbulence Database (JHTDB), and atmospheric weather data in form of temperature and geopotential from Data Download are used. Data sequences for a reference are created by using fixed intevals along a spatial or temporal dimension of the data. LSiM consistently achieves the highest mean correlation values above 0.9 and lower standard deviations compared to other metrics on all three data sets, as shown in Fig. 4.
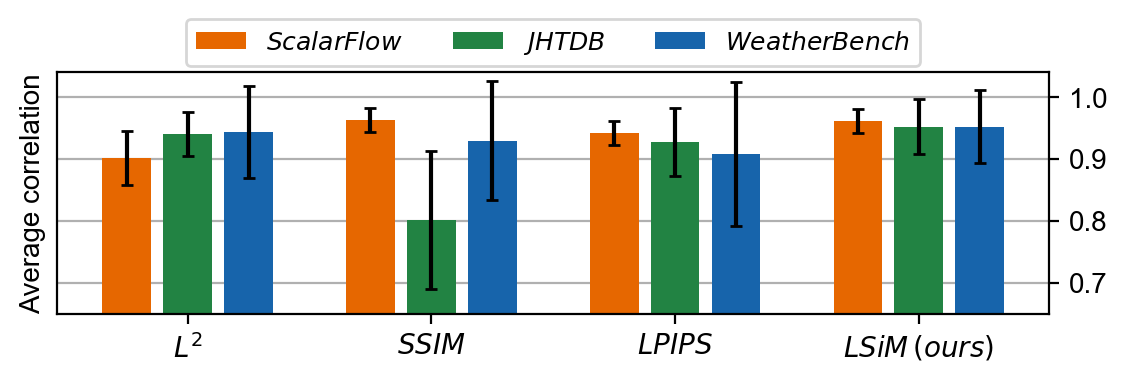 Fig. 4: Average correlation comparison across different spatial and temporal steps on the three real-world data repositories. LSiM recovers the correct ordering of the data with highest accuracy, despite never being trained on them.