This is a tough task, as many existing data sets for generative models come without quantifiable ground truth data. In contrast the 1D airfoil case of our recent AIAA paper is highly non-trivial but comes with plenty of GT data. Thus, it’s easy to check whether a neural network such as a diffusion model learned the correct distribution of the solutions (by computing the “coverage” in terms of distance to the GT solutions), and to check how much training data is needed to actually converge.
Here’s a Jupyter notebook that explains how to use it: https://colab.research.google.com/github/tum-pbs/Diffusion-based-Flow-Prediction/blob/main/sample.ipynb
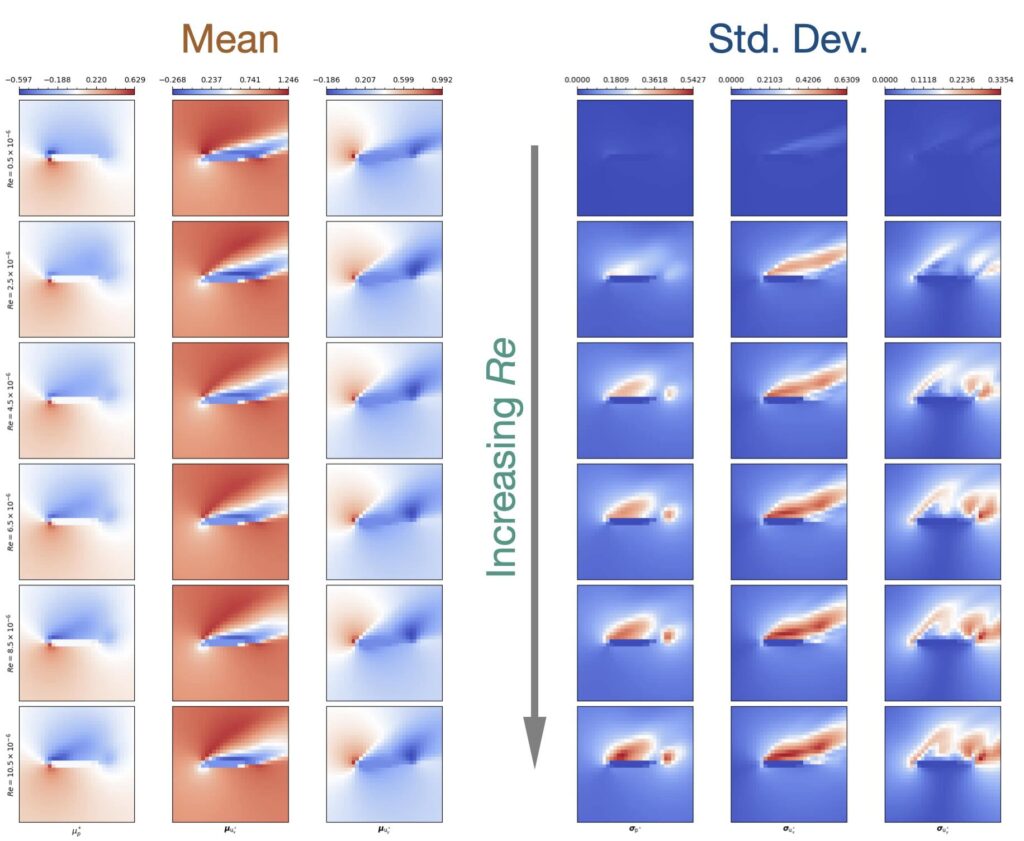
The image below shows the content of the data set: the input is a single parameter, the Reynolds number, and with increasing Re the complexity of the solutions rises, and starts to vary more and more. The mean on the left hand side stays largely the same, while the increasing and changing standard deviation of the solutions (show on the right) highlights the enlarged complexity of the solutions. Intuitively, the low Re cases have flows that mostly stick to the mean behavior, while the more turbulent ones have a larger number of different structures from more and more complex vortex shedding. As a consequence, a probabilistic neural network trained on this case will need to figure out how the solutions change along Re. Also, it will need to figure out how to generate the different modes of the solutions that arise for larger Re cases.
For details and comparisons with other approaches, please check out section (B) of the paper. The data of the 1D case itself is checked in at https://github.com/tum-pbs/Diffusion-based-Flow-Prediction/tree/main/datasets/1_parameter.